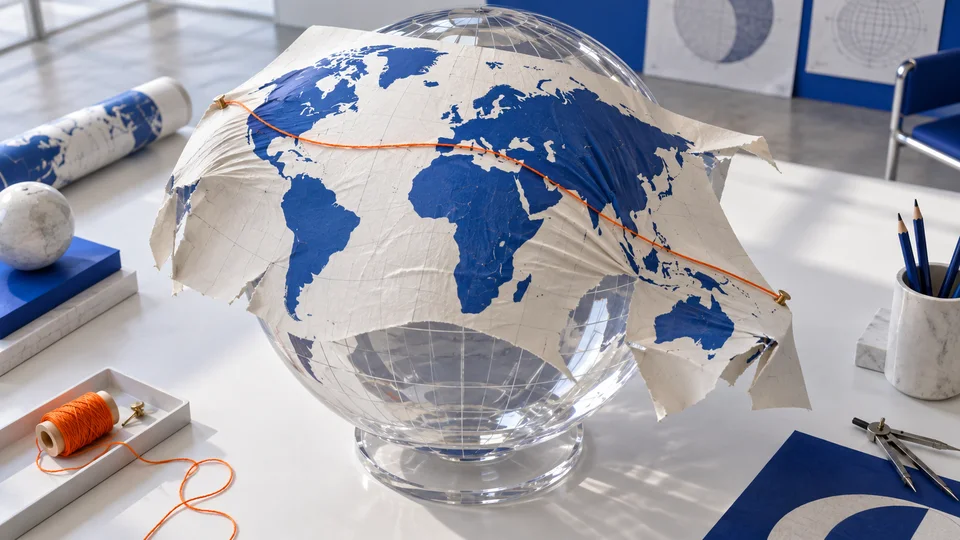
Peel an orange in one piece and try to press the skin flat on a table. It will not go. Push the middle down and the edges tear; hold the edges and the middle buckles. Whatever you do, some part of that skin has to stretch, shear or split. Every world map you have ever seen is the result of somebody deciding, deliberately, where to put the damage.
This is not a limitation of technique that better cartography will one day overcome. It is a theorem. In 1827 Carl Friedrich Gauss proved a result he was pleased enough with to name the Theorema Egregium, the remarkable theorem: the curvature of a surface is intrinsic to it, measurable by an ant crawling on the surface without any knowledge of the space it sits in. A sphere and a flat plane have different intrinsic curvature. No amount of bending or rolling can turn one into the other without stretching. The United States Geological Survey puts the practical consequence plainly: no flat map can rival a globe in truly representing the surface of the entire Earth, so every flat map misrepresents it in some way.
Choosing which truth to keep
A projection, then, is a decision about what to preserve and what to sacrifice. The usual properties on the table are shape, area, distance and direction, and you cannot have them all.
Conformal projections preserve local shapes and angles, so a small island looks like the right island, but they inflate areas away from where they touch the globe. Equal-area projections preserve relative size, so a country covering twice the ground occupies twice the paper, but they shear shapes to do it. Equidistant projections keep true distances along certain lines and nowhere else. Compromise projections deliberately do none of these perfectly, distributing modest error everywhere rather than concentrating it.
Cartographers have a way of showing this. In the nineteenth century Nicolas Auguste Tissot devised the indicatrix: scatter identical tiny circles across the globe, project them, and look at what happens. On a conformal map they stay circular but swell enormously towards the poles. On an equal-area map they keep their area but squash into ellipses. There is no projection on which they all stay small, round and identical, and there never will be. The USGS's own reference literature on the subject, including John Snyder's exhaustive working manual, is largely a catalogue of trade-offs rather than a search for a winner.
Mercator was a tool, not a portrait
The most abused projection in the world is also one of the most successful pieces of applied mathematics ever produced, and most of the abuse comes from using it for a job it was never built to do.
Gerardus Mercator published his world map in 1569 with a title that stated its purpose outright: a new and enlarged description of the Earth, corrected and adapted for the use of navigators. The problem he solved was specific. A sailor holding a constant compass bearing traces a curve across the globe called a rhumb line or loxodrome. On most maps that curve is a nuisance to plot. On Mercator's, it is a straight line. You lay a ruler between two ports, read off the angle, and sail it. For four centuries that was worth almost any price.
The price is area. To keep angles true, Mercator's projection stretches the map east to west as you move away from the equator, and then stretches it north to south by exactly the same factor to preserve shape. The two stretches multiply, so area is exaggerated by the square. At sixty degrees of latitude, areas appear roughly four times too large. By Greenland the effect is spectacular.
Hence the famous comparison. Greenland covers about 2.2 million square kilometres. Africa covers about 30 million. Africa is around fourteen times the size, yet on a Mercator map the two look broadly comparable, with Greenland sometimes appearing the larger of the pair. Nothing is wrong with the mathematics. Something is very wrong with hanging it on a classroom wall and calling it a picture of the world.
The map wars
That objection became a public argument in 1973, when the German historian and filmmaker Arno Peters held a press conference in Bonn to launch a world map he presented as a corrective to centuries of Eurocentric cartography. His map was equal-area: on it, tropical and southern countries occupied their true share of the paper, and the effect on audiences accustomed to Mercator was startling.
Cartographers responded with a mixture of agreement and irritation, and the irritation had two grounds. First, the projection was not new. The Scottish clergyman James Gall had published essentially the same construction in 1855, which is why it is now generally called Gall-Peters. Second, and more substantively, equal-area cylindrical projections buy their honest areas at a steep cost in shape. On Gall-Peters, equatorial landmasses are stretched vertically into thin elongated forms while mid-latitude regions are squashed horizontally. Africa is the right size and the wrong shape. Swapping one distortion for another is a choice, not a solution.
There was also the fact that dozens of equal-area projections already existed, several of them far kinder to shape, and none of them had been marketed with a press conference. The dispute grew heated enough that in 1989 seven North American geographic and cartographic organisations issued a joint resolution urging that rectangular world maps of any kind, Mercator and Gall-Peters alike, be dropped for general-purpose use, on the grounds that squeezing a globe into a rectangle inevitably grossly distorts the high latitudes. Mark Monmonier later devoted an entire book, Rhumb Lines and Map Wars, to how a technical disagreement about cylinders became a moral quarrel about colonialism, and to how badly the reporting handled it.
The mainstream response was to abandon rectangles. The National Geographic Society adopted Arthur Robinson's compromise projection in 1988, then replaced it with the Winkel tripel in 1998, both of which curve the meridians inward and accept a little error everywhere in exchange for a globe that looks like a globe. In 2017 Boston Public Schools made news by switching classroom maps to Gall-Peters, a decision widely reported as decolonising the curriculum and widely grumbled about by cartographers who would have preferred any of a dozen better equal-area options.
What the choice does to your head
The reason any of this matters is that a map is not consulted so much as absorbed. Nobody memorises a projection's error profile. People simply acquire a sense of how big places are, and that sense is supplied by whatever hung on the wall in year six.
Mercator's inflation of the high latitudes systematically enlarges Europe, Russia, Canada and the United States while shrinking Africa, South America, India and Southeast Asia. Whether or not Mercator intended anything of the sort, and he plainly did not, generations of readers absorbed a distorted sense of proportion from a navigation instrument.
The irony is that Mercator has quietly won anyway. Nearly every online slippy map uses a variant of his projection, because when you zoom to street level conformality is exactly what you want: buildings the right shape, north reliably up, and the ability to rotate and scale without anything looking bent. The projection built for sailors turned out to be perfect for people looking for a chemist.
The useful habit is not to find the honest map. There isn't one. It is to ask, of any map, what question it was drawn to answer, and to keep a globe somewhere in the house for when the answer matters.